

Issue #104 - A/B Testing: From Hypothesis to Impact

💊 Pill of the Week
In the world of data-driven product development, marketing, and user experience design, intuition is a starting point, not a conclusion. A/B testing, or controlled experimentation, is the cornerstone methodology that allows teams to move from "we think" to "we know." It provides a rigorous framework for measuring the real-world impact of a change, whether it's a new feature, a different headline, or a refined machine learning model.
A/B testing allows us to move from "we think" to "we know."
This guide walks through the complete lifecycle of an A/B test, from crafting a solid hypothesis to avoiding common statistical traps.
What is an A/B Test?
At its core, an A/B test is a randomized controlled experiment designed to compare two versions of a single variable. It works by splitting a population of users into two distinct groups:
Group A (The Control): This group experiences the current version of the product. They provide the baseline for comparison.
Group B (The Treatment or Variant): This group is exposed to the new version you want to test.
By collecting data on how each group behaves, you can measure the effect of the change and determine with statistical confidence whether the new version is better, worse, or has no different effect than the original.
This method isolates the causal impact of your change, filtering out the noise of daily fluctuations and user behaviour quirks.
The A/B Testing Workflow
A successful experiment is far more than just splitting traffic. It's a disciplined process that requires careful planning, execution, and interpretation.
Step 1: Formulate a Clear Hypothesis
Every test must begin with a testable hypothesis. A good hypothesis is specific, measurable, and provides a reason for the expected change. It typically follows this structure:
If we [implement this change], then we expect [this outcome to happen] because [this is the underlying reason].
For example: "If we change the 'Buy Now' button color from blue to bright orange, then we expect the click-through rate to increase by 2% because the new color has higher contrast and creates a greater sense of urgency."

This step is critical because it forces you to articulate your assumptions and pre-define your primary success metric, preventing you from "cherry-picking" positive results later.
Step 2: Design the Experiment
Designing a solid experiment is where the statistical foundation is laid. At this stage, you are essentially deciding what success means, how you will measure it, and how confident you need to be in the results before taking action. Several key decisions shape the quality of your test:
Define Your Metrics
Start by clarifying what you are optimizing for.
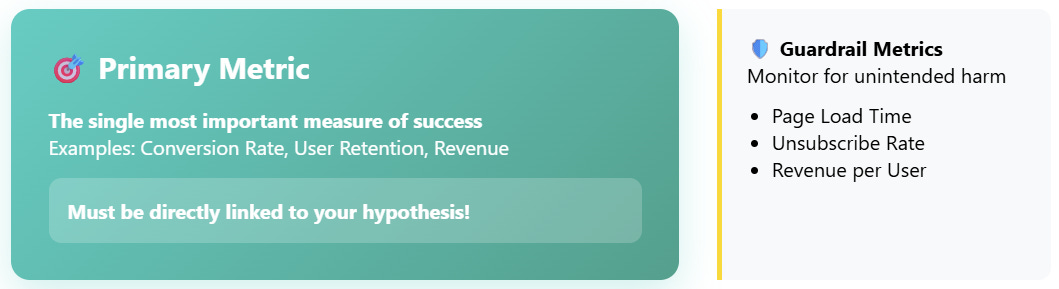
Primary Metric: This is the single most important outcome that will tell you whether your hypothesis holds. Think of it as the “north star” of your test. For example, you might care about conversion rate, user retention, or revenue per visitor. Whatever you choose, it should be tightly linked to your hypothesis and reflect the change you want to drive.
Secondary or Guardrail Metrics: No experiment exists in isolation—improving one area can sometimes unintentionally harm another. Guardrail metrics are there to make sure this doesn’t happen. For instance, a change that boosts conversions but significantly slows down page load times could do more harm than good in the long run. By tracking supporting metrics such as unsubscribe rate, engagement depth, or average revenue per user, you can detect trade-offs before they become costly.
Choose the Randomization Unit
Next, decide the “unit” you will randomize. This choice depends on how users interact with your product.
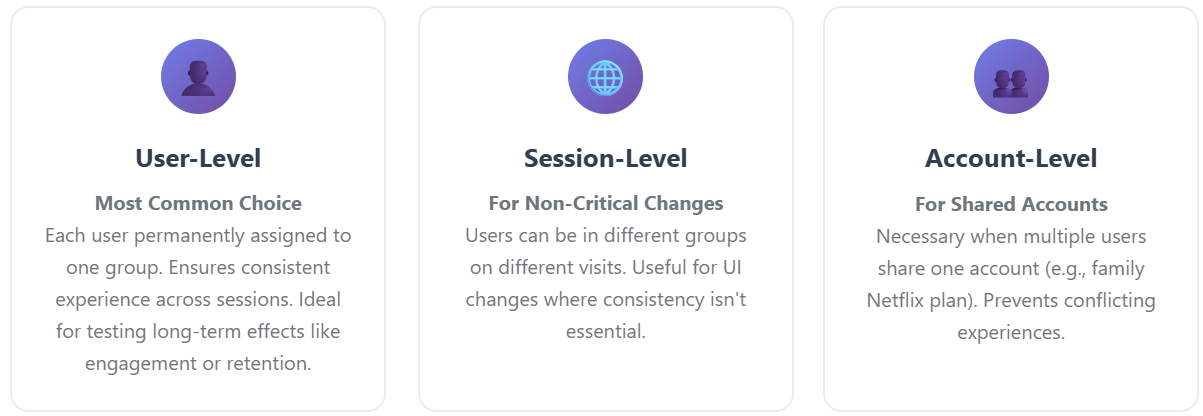
User-level randomization: This is the most common approach. Each user is permanently assigned to a single group (control or variant), which ensures they have a consistent experience every time they return. This is particularly important when you want to measure long-term outcomes, like engagement or retention.
Session-level randomization: In this setup, a single user might see different variants across separate visits. While this can feel inconsistent, it works well for lightweight changes to the interface or design, where consistency doesn’t matter as much.
Account-level randomization: In products where multiple people share the same account—think of a family Netflix subscription—assigning treatments at the account level avoids conflicts and keeps the shared experience consistent.
Determine the Sample Size
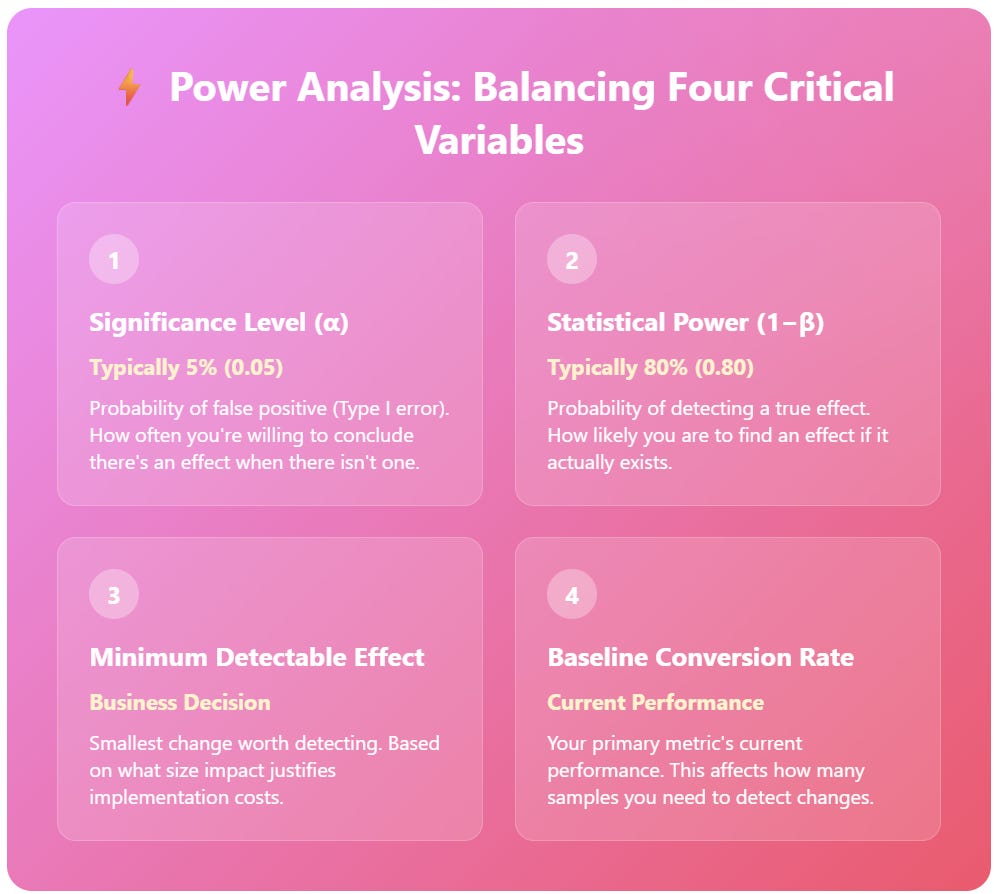
Finally, you need to make sure your experiment includes enough data to detect meaningful differences. This is where power analysis comes into play. It balances four interconnected elements:
Significance Level (α): The threshold for how often you’re willing to accept a false positive (a Type I error). In most cases, this is set at 5% (0.05), meaning you’re comfortable being wrong 1 out of 20 times.
Statistical Power (1−β): The probability of detecting a real effect if one exists. Conventionally, researchers aim for 80% power, which means you accept a 20% chance of missing a true effect.
Minimum Detectable Effect (MDE): The smallest improvement (or decline) that you care about. This is not just a statistical number but a business decision—what size of change makes the cost of building, shipping, or maintaining the new variant worthwhile?
Baseline Conversion Rate: Finally, you need a benchmark. Knowing your current performance level (e.g., your typical conversion rate) provides the context for calculating how big a sample you need to spot the MDE.
Step 3: Run the Test and Analyze the Results
Once your experiment has been launched and has gathered the amount of data you planned for, it’s time to dig into the results. The central question now is whether the differences you observe between groups are likely to be real or just the product of random chance.
This is where statistical hypothesis testing comes in.
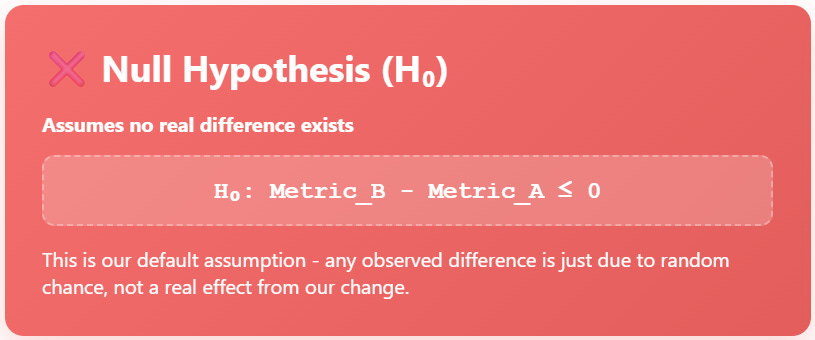
The Null Hypothesis (H₀): By default, we assume there is no difference between the control and the treatment. In other words, the treatment did not improve the metric. Formally, this might look like:
H₀: Metric₍B₎ − Metric₍A₎ ≤ 0
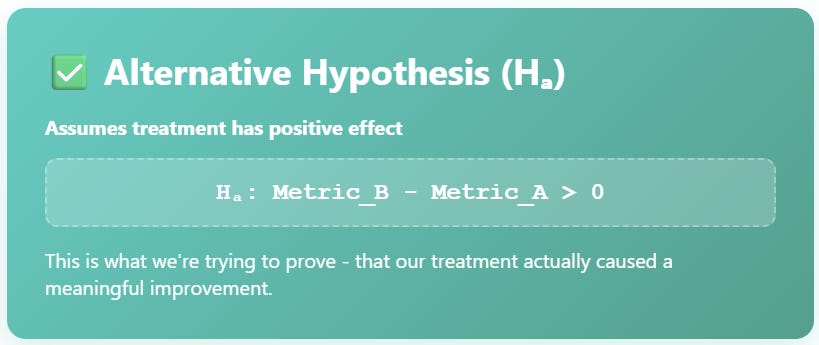
The Alternative Hypothesis (Hₐ): This represents the outcome you are hoping for—that the treatment has a positive effect compared to the control. Written formally:
Hₐ: Metric₍B₎ − Metric₍A₎ > 0
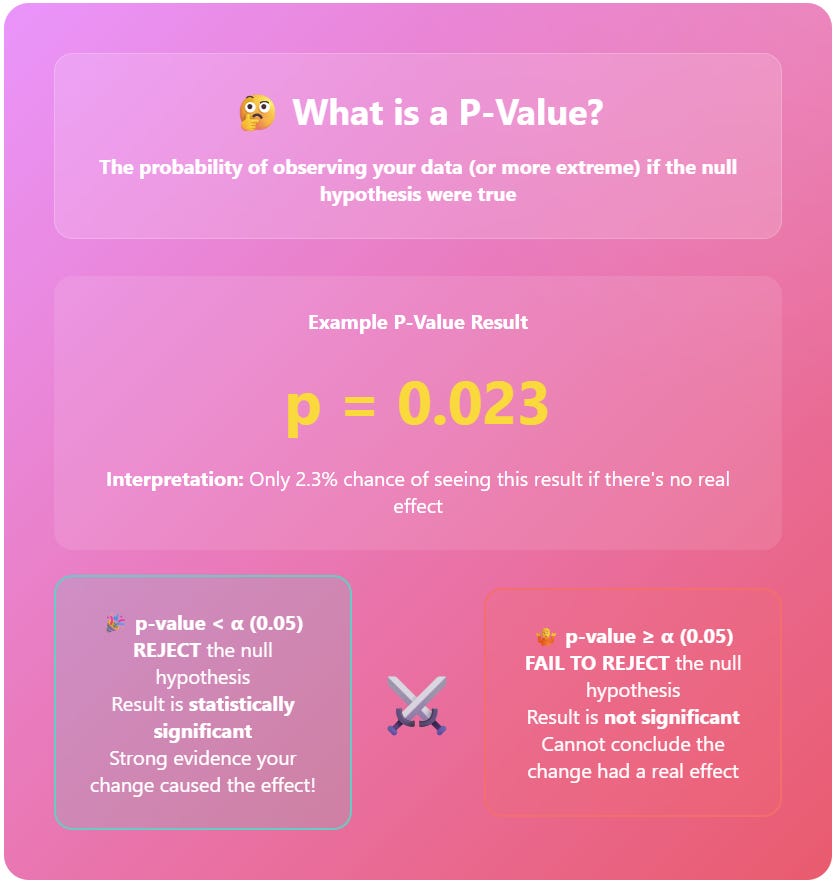
With these hypotheses in place, you calculate a p-value, which tells you how likely it would be to observe results as extreme as yours if the null hypothesis were true.
If the p-value < α (say, less than 0.05), you reject the null hypothesis. In plain terms, the data provides strong evidence that your change really did have an effect.
If the p-value ≥ α, you fail to reject the null hypothesis. This doesn’t mean the treatment had no effect—it just means your data isn’t strong enough to confidently say it did.
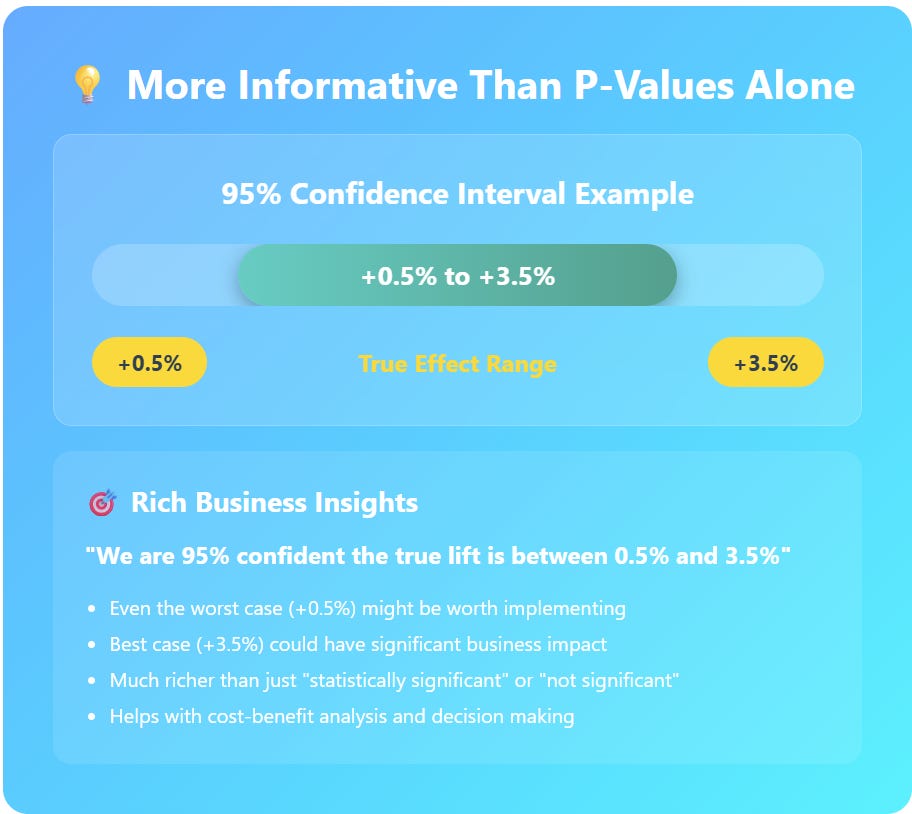
While p-values are a useful starting point, they can feel like a blunt “yes/no” tool. That’s why many practitioners prefer confidence intervals, which offer a richer perspective. For example, instead of simply declaring “the effect is significant”, you might calculate a 95% confidence interval for the difference between groups and get something like [+0.5%, +3.5%]. This tells you that, with high confidence, the true improvement lies somewhere in that range—a far more actionable insight than a binary verdict.
In short:
p-values help you answer “did it work?”
confidence intervals help you answer “how much did it work, and what should we expect in practice?”
Both perspectives together make your conclusions stronger and more useful.
🎓 Become a Full Stack AI Engineer
TowardsAI’s 60-hour Full Stack AI Engineering course will take you from AI enthusiast to certified LLM Developer—equipped to build, deploy, and scale real-world AI products.

🎯 What you’ll get:
Hands-on training with LLMs, Prompting, RAG, Fine-tuning, and AI Agents
Build your own advanced AI product from scratch (perfect for your portfolio or MVP)
Access to 92 lessons, practical code projects, and ready-to-run Colab notebooks
Certification + a showcase project to help land an LLM Developer or AI Engineer role
Ongoing updates, mentorship, and exclusive Slack community access
Risk-free learning with a 30-day money-back guarantee
💡 Whether you want to boost your career, launch a startup, or drive innovation inside your company, this course gives you the skills top employers are hiring for right now.
*Sponsored: by purchasing any of their courses you would also be supporting MLPills.
Ensuring Trust: A/A Testing
Before you can put faith in the results of an A/B test, you first need to trust the system that generates those results. One of the simplest—but most powerful—ways to do this is with an A/A test.
Keep reading with a 7-day free trial
Subscribe to Machine Learning Pills to keep reading this post and get 7 days of free access to the full post archives.