


RW #4 - EDA applied to Netflix (part II)


💊 Pill of the Week
Welcome back! In Part I, we laid the groundwork for exploring Netflix’s data—distributions, ratings, and top producing countries. Now, in Part II, we’re diving deeper into specific questions you can answer with this dataset. These insights further illustrate how each EDA discovery can supercharge a machine learning project.
✏️ Article and code by Muhammad Anas.
Do you want a reminder? Check part I before moving on:

What will be covered in this part?
We will continue exploring EDA techniques by using the Netflix example. Here is a summary of what will be covered in this issue:
Genre Breakdown (Movies vs. TV Shows)
Top 10 Actors on Netflix
Movies vs. TV Shows Over Time
Best Time to Release on Netflix
TV Shows with the Most Seasons
💎Next Wednesday we will send to all paid subscribers the full notebook, including all the code. This is a one-time send—only subscribers with an active paid membership at that time will receive it via email.💎
6. Genre Breakdown: Movies vs. TV Shows

Why Care?
Understanding what genres dominate each format (Movies vs. TV Shows) helps with personalization. For instance, a user who loves Romantic TV Shows but avoids Action Movies might prefer different content recommendations.
For a production strategy, Netflix might spot gaps in certain genres.
Finding:
Movies and TV shows have overlapping genres (e.g., Drama, Comedy), but the top 10 for each format highlights distinct user interests.
The bar plots reveal which 10 genres are most popular in each category. For example, you might see that Drama is #1 for Movies, while International TV ranks highly for TV Shows.
ML Angle:
Genre-based embeddings: Each genre can become a feature in a recommendation model. If a user frequently watches a certain genre, your algorithm can boost those titles.
Content clustering: Grouping titles by genre could help you tailor personalized recommendations or identify underserved niches.
💎 Here’s a snippet of the code. The full notebook, including all the code, will be sent exclusively to paid subscribers on Wednesday. This is a one-time send—only subscribers with an active paid membership at that time will receive it via email.💎
# Top 10 Genres for Movies
netflix_df[netflix_df["type"]=="Movie"]["genre"]
    .value_counts()[:10]
    .plot(kind='barh', color=colors)

# Top 10 Genres for TV Shows
netflix_df[netflix_df["type"]=="TV Show"]["genre"]
    .value_counts()[:10]
    .plot(kind='barh', color=colors)
Business Take:
If certain genres are strong in TV Shows but weaker in Movies (or vice versa), Netflix might invest more in those unbalanced areas to broaden appeal or double down on existing strengths.


7. Top 10 Actors on Netflix

Why Care?
Star power can drive viewer engagement and subscriptions. Think about how big names (e.g., Adam Sandler or Shah Rukh Khan) can bring massive audiences.
Understanding who appears most often may inform how Netflix negotiates or markets content.
Finding:
By splitting the
castcolumn (handling missing values), we see which actors show up most across the catalog. The top 10 often includes frequent collaborators or multi-title deals (especially with Netflix originals).
ML Angle:
Actor-based recommendations: If a user is a huge fan of Actor X, your model can surface more content starring Actor X.
Popularity metric: Actors who appear more frequently could weigh heavily in user engagement predictions.
# Create a DataFrame of actors
netflix_df['cast'] = netflix_df['cast'].fillna('No Cast Specified')
filtered_cast = netflix_df['cast'].str.split(',',expand=True).stack().to_frame()
filtered_cast.columns = ['Actor']
actors = filtered_cast.groupby(['Actor']).size().reset_index(name='Total Content')
actors = actors[actors.Actor !='No Cast Specified']

top_actors = actors.head(10).sort_values(by=['Total Content'])
x = top_actors["Actor"]
y = top_actors["Total Content"]

sns.barplot(x=x, y=y)
Business Take:
Actors with a high volume of content on Netflix can be central to marketing campaigns or further deals. Netflix might also spot up-and-coming talents who appear in multiple successful titles.
🎓Further Learning*
Let us present: “From Beginner to Advanced LLM Developer”. This comprehensive course takes you from foundational skills to mastering scalable LLM products through hands-on projects, fine-tuning, RAG, and agent development. Whether you're building a standout portfolio, launching a startup idea, or enhancing enterprise solutions, this program equips you to lead the LLM revolution and thrive in a fast-growing, in-demand field.

Who Is This Course For?
This certification is for software developers, machine learning engineers, data scientists or computer science and AI students to rapidly convert to an LLM Developer role and start building
*Sponsored: by purchasing any of their courses you would also be supporting MLPills.
8. Movies vs. TV Shows Over Time
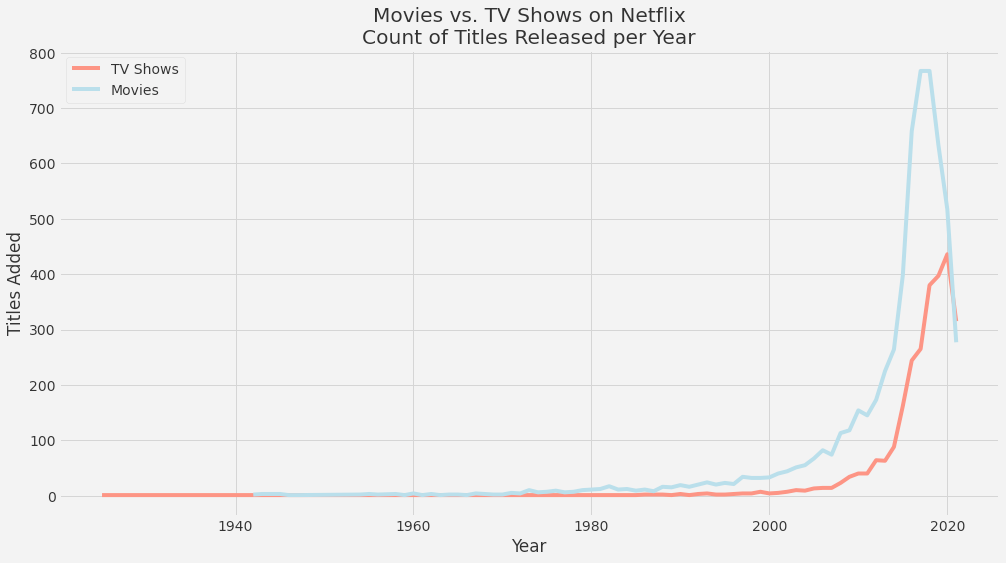
Why Care?
Is Netflix pivoting more to TV Shows or sticking with Movies? Over time, user behavior and content costs can shape these strategies.
This also reveals the shifting focus from 2005–2018 (or whichever date range you choose).
Finding:
Keep reading with a 7-day free trial
Subscribe to Machine Learning Pills to keep reading this post and get 7 days of free access to the full post archives.