

Issue #102 - Knowledge Graphs to make RAG smarter

💊 Pill of the Week
A knowledge graph is a structured way of representing information so that machines can interpret and reason over it. It organises entities—such as people, places, organisations, or concepts—and connects them through clearly defined relationships. Each entity is represented as a node, and each connection as an edge.
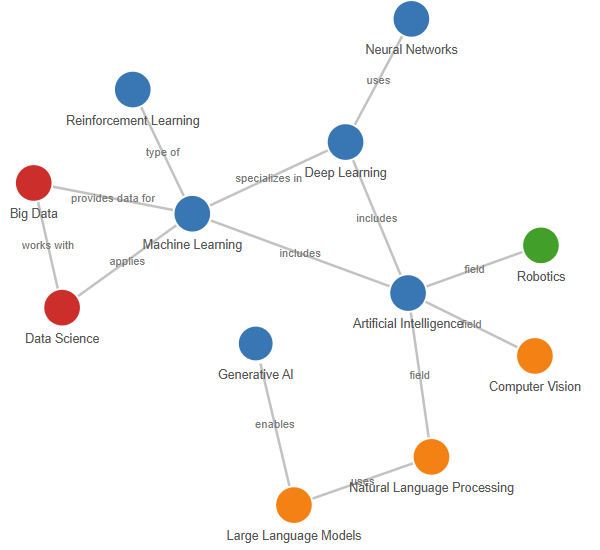
What makes a knowledge graph powerful is its ability to represent not just isolated facts but the context around them. For example, instead of storing “Alan Turing” and “Bletchley Park” as two unrelated entries, a knowledge graph would store the relationship “worked at” between them. This transforms a dataset into a web of interconnected meaning.
By representing knowledge in this format, systems can perform queries, draw inferences, and retrieve information in ways that are both precise and transparent.
Why They Matter in RAG Systems
In a typical RAG (retrieval-augmented generation) setup, an LLM generates answers based on documents retrieved via semantic similarity. This works well when the target information is short and direct. But it has its limits. Embedding-based retrieval can’t always tell which pieces of information are logically connected, or whether multiple facts fit together in a meaningful sequence.

This is where knowledge graphs make a significant difference.
By introducing structure to the retrieval process, a knowledge graph allows the system to go beyond keyword matches or embedding proximity. Instead, it can follow specific relationships between facts. This enables:
Multi-step reasoning: When an answer depends on a chain of facts—such as tracing ownership or causal links—the graph helps retrieve connected information in the correct order.
Factual grounding: Because the graph consists of verified triples, the model's responses are anchored in known relationships rather than speculative text matches.
Explainability: The system can show how a conclusion was reached by displaying the path of relationships it followed across entities.
Precision and filtering: By constraining retrieval to a known subset of the graph (e.g. all entities in a specific domain or project), noise is reduced and irrelevant data is excluded from context.
For high-stakes or domain-specific applications—legal, medical, financial—these properties are not just useful; they’re essential.
How Knowledge Graphs Work
Knowledge graphs are not built in a single step. They follow a layered process that transforms raw information into structured, queryable knowledge.
It begins with data collection. This data may come from structured sources (like databases or CSVs) or unstructured ones (such as articles, documents, emails, or reports). The quality and breadth of this input determine the eventual usefulness of the graph.
Next is entity and relationship extraction. Using natural language processing techniques—often enhanced with large language models—the system identifies key entities and the relationships between them. For instance, from the sentence “Marie Curie discovered polonium,” the graph might extract:
(Marie Curie, discovered, polonium).
This forms a triple: subject, predicate, and object. These triples become the core data in the graph.
The system then applies an ontology—a formal schema defining entity types, allowed relationships, and constraints. This ensures that information is categorised consistently. For example, it may enforce that “a Person can be affiliated with an Organisation” but not “own a Country.”
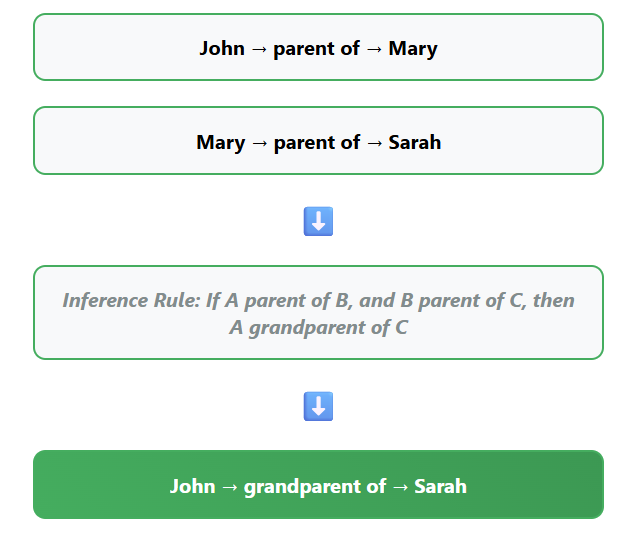
Once structured, the graph supports reasoning. Logical rules can be used to derive new insights. If the graph knows that “A is the parent of B” and “B is the parent of C,” it can infer that “A is the grandparent of C,” even if that fact wasn’t originally stored.
Finally, the graph is made available for querying and integration. This could be through a formal query language like Cypher or SPARQL, or by feeding results into a downstream system—such as a chatbot, recommendation engine, or RAG pipeline.
What Makes Up a Knowledge Graph
Every graph has a consistent set of core components, each with a specific role:
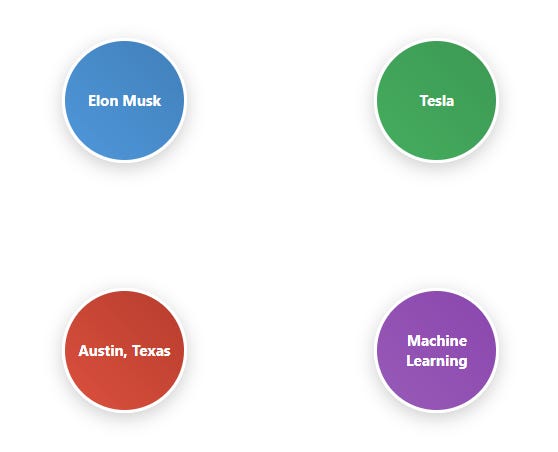
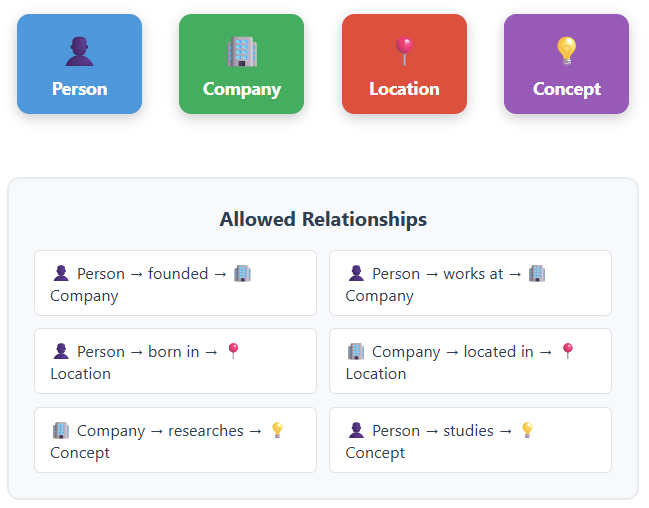
Entities are the subjects of the data—individuals, companies, locations, concepts, and so on. They act as the anchors for information. For instance, “Tesla” or “Machine Learning” would be stored as distinct nodes.
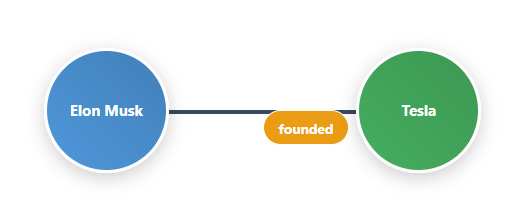
Relationships connect those entities. They describe how things are linked: “works at,” “founded,” “located in,” or “produced by.” This transforms flat data into a rich web of associations.
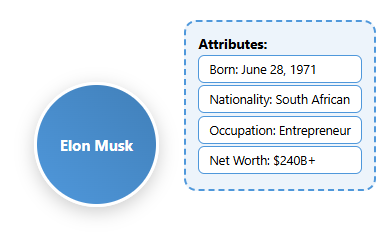
Attributes provide detailed information about entities. For example, a “Person” entity might have attributes like “date of birth,” “nationality,” or “occupation.” These add depth to the graph without cluttering the structural relationships.
Ontology serves as the blueprint. It defines which entities exist, how they relate, and which properties they can hold. This ensures logical consistency and makes it easier to extend the graph as new data arrives.
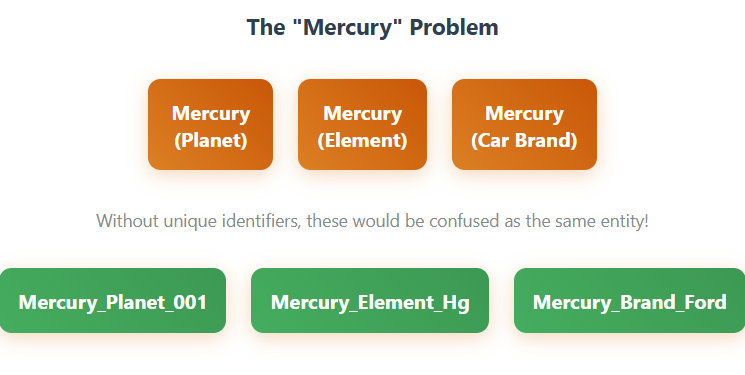
Identifiers prevent confusion between similar or duplicate names. The term “Mercury” might refer to a planet, a metal, or a car brand. Each would have a distinct identifier to prevent incorrect connections.
Inference logic allows the graph to generate new facts automatically. These rules extend the utility of the graph by filling in gaps, identifying indirect links, and surfacing insights not explicitly recorded.
Together, these components create a system that stores knowledge in a machine-friendly, logically coherent format.
❓Before continuing…
Could you please let me know what you think of this type of issues?
Many thanks.
If you like it please:
❤️Like
🔄Restack
This really helps me bringing you the best content.
📖 Book of the Week
Just Announced: Learning Tableau 2025 (6th Edition)
By Tableau Zen Master Joshua N. Milligan

Tableau just stepped into the AI era — and this book is your roadmap to mastering it.
If you’re a BI dev, data analyst, scientist, or researcher, Learning Tableau 2025 gives you the tools to go from raw data to real-time, AI-powered insight.
What’s new in this edition?
✅ AI-enhanced features: Master Tableau Pulse & Tableau Agent
✅ Dynamic dashboards: Build experiences that react to data in real time
✅ Advanced mapping: Explore new geospatial functions
✅ Smarter prep: Use Tableau Prep’s upgraded capabilities
✅ Data integration: Bring together diverse sources for complete analysis
Whether you’re new to Tableau or leveling up, this is a full-stack guide — from basics to advanced use cases — written by one of Tableau’s top community leaders.
💬 If you're looking to improve your data storytelling, automate insights, or explore predictive analytics with Tableau — this is the book to grab.
📅 Publishing: August 2025
📚 Includes free PDF with print/Kindle editions
How to Build One (In Practice)
Creating a knowledge graph isn't just about linking facts—it's about structuring information in a way that machines can reason over and humans can query intuitively. While the concept may sound abstract, the process is surprisingly methodical. The following six steps walk through how to construct a functional knowledge graph from scratch. Whether you're dealing with scientific documents, enterprise data, or unstructured content, this workflow helps turn information into structured, queryable knowledge.
Collect data from various sources like documents, databases, APIs, or unstructured text. This raw information forms the foundation of your knowledge graph.
Extract entities and relationships using natural language processing techniques to identify key entities and the relationships between them from your source material.
Form triples by structuring the extracted information as subject-predicate-object relationships. These triples become the core building blocks of your graph.
Apply ontology by defining entity types, allowed relationships, and constraints that ensure consistent categorization and prevent incompatible data entries in your domain.
Enable reasoning by storing triples in a graph database where logical rules can derive new insights, detect patterns, and infer new knowledge from existing facts.
Build querying capabilities that allow you to retrieve structured information from the graph and feed it into downstream systems like LLMs, enabling complex queries and knowledge-driven applications.
Example: Building a Healthcare Knowledge Graph
To ground the above steps in something more tangible, here’s a practical example set in the healthcare domain.
We'll walk through how each phase—from collecting raw data to enabling reasoning—plays out when modelling clinical information. You’ll see how even a handful of text snippets can be transformed into a machine-interpretable structure that supports powerful queries and decision support.
Step 1: Data Collection Begin by gathering information from your domain-specific sources. In healthcare, this might be discharge summaries, EHR notes, and clinical protocols. For other domains, it could be research papers, databases, emails, or reports. The quality and breadth of this input determine the eventual usefulness of the graph.
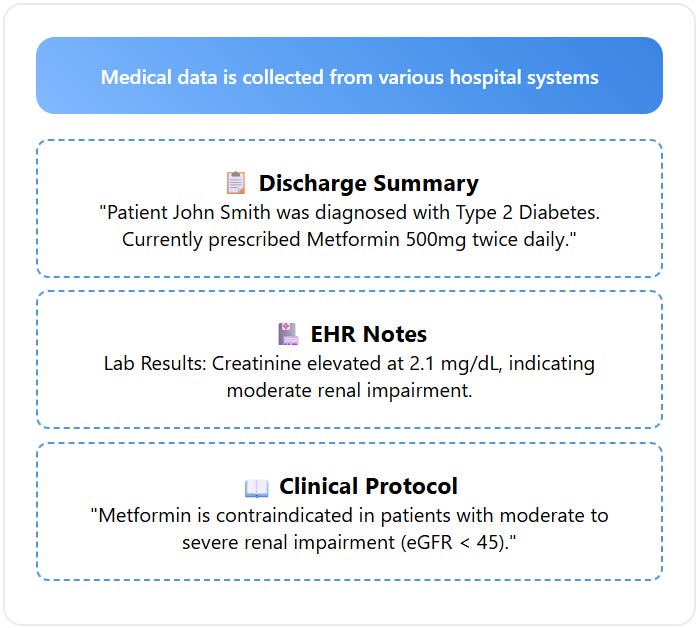
Step 2: Entity and Relationship Extraction Extract triples from text using LLM-based prompts or trained models. Using natural language processing techniques, identify key entities and the relationships between them. This creates the raw facts the graph needs. For example, from "Patient John Smith was diagnosed with Type 2 Diabetes," extract the triple: (John Smith, diagnosed with, Type 2 Diabetes).
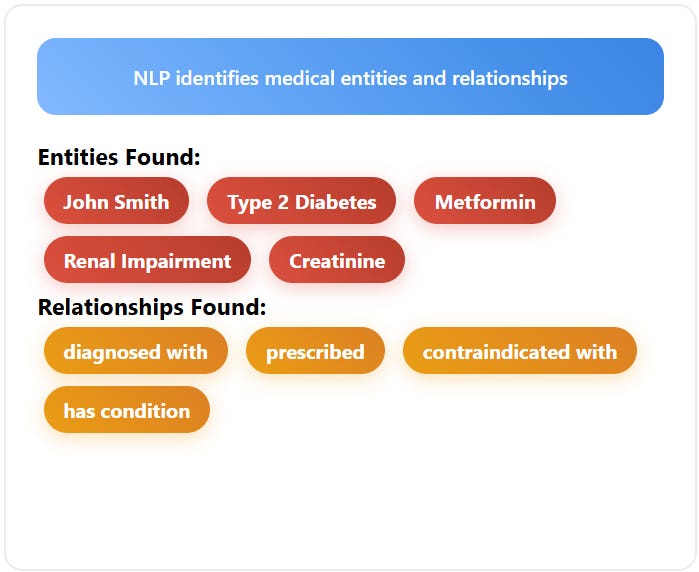
Step 3: Triple Formation Structure your extracted information as subject-predicate-object triples. These triples become the core data in the graph:
Keep reading with a 7-day free trial
Subscribe to Machine Learning Pills to keep reading this post and get 7 days of free access to the full post archives.