

Issue #106 - Introduction to K-means clustering

💊 Pill of the week
Today we will introduce K-means Clustering! K-means is one of the most popular and fundamental unsupervised learning algorithms in machine learning. This elegant yet powerful technique is designed to discover hidden patterns and group similar data points together without any prior labels, making it an essential tool for exploratory data analysis and pattern recognition.
At the core of K-means is the simple yet effective goal of partitioning data into K distinct clusters, where each data point belongs to the cluster with the nearest centroid (cluster center). The algorithm iteratively refines these cluster assignments and centroid positions until it converges to a stable solution. By minimizing the within-cluster sum of squares (WCSS), K-means creates compact, well-separated groups that reveal the natural structure within your data.
How does it work?
The working mechanism of K-means can be described as follows:
Initialization: The algorithm begins by randomly selecting K initial centroids from the dataset or by using more sophisticated initialization methods like K-means++, which strategically places initial centroids far apart from each other.
Assignment Step: Each data point is assigned to the nearest centroid based on a distance metric (typically Euclidean distance). This creates K initial clusters, where each cluster contains all the points closest to its centroid.
Update Step: After all points have been assigned, the algorithm recalculates the position of each centroid by computing the mean of all data points assigned to that cluster. This is where the "means" in K-means comes from.
Iteration: The assignment and update steps are repeated iteratively. In each iteration, data points may switch clusters as centroids move, and new centroids are computed based on the updated cluster memberships.
Convergence: The algorithm continues until convergence is achieved – either when centroids no longer move significantly between iterations, when cluster assignments remain stable, or when a maximum number of iterations is reached.
The beauty of K-means lies in its simplicity and efficiency. Despite its straightforward approach, it can uncover meaningful patterns in complex datasets, making it a go-to choice for many clustering tasks.
K-Means in action
Let’s see it in action with an example.
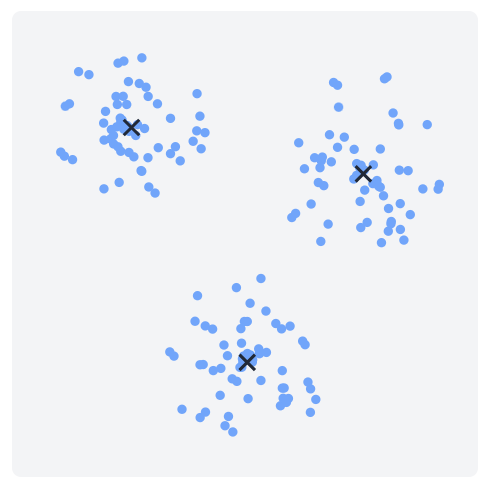
This is our initial data. We can see that we have 4 clusters.
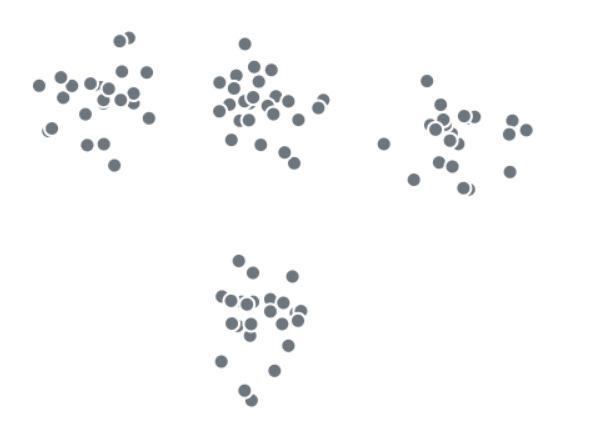
To make the example simple, let’s select K equal to 4. We initialise these 4 clusters centroids randomly:
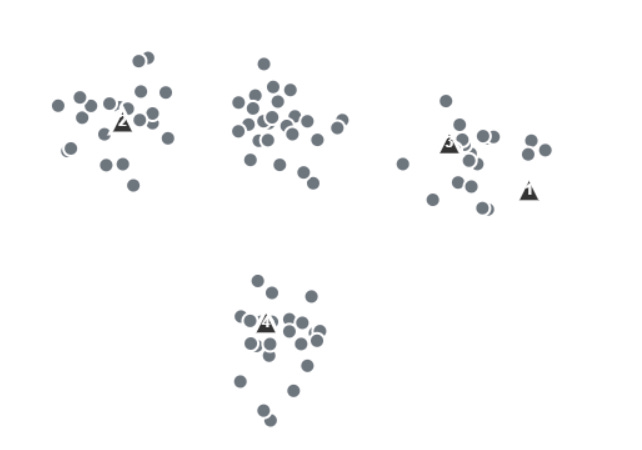
Now the data points are assigned to the nearest centroid:
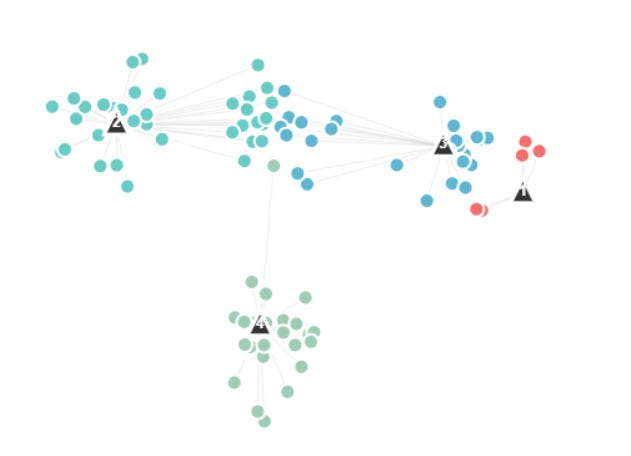
Now that they are assigned, the centroids are moved to the cluster centers:
We check for convergence, have the clusters moved significantly from one step to another? If so we repeat this process, we reassign the data points and reupdate. If not, we finished, we have our data clustered.
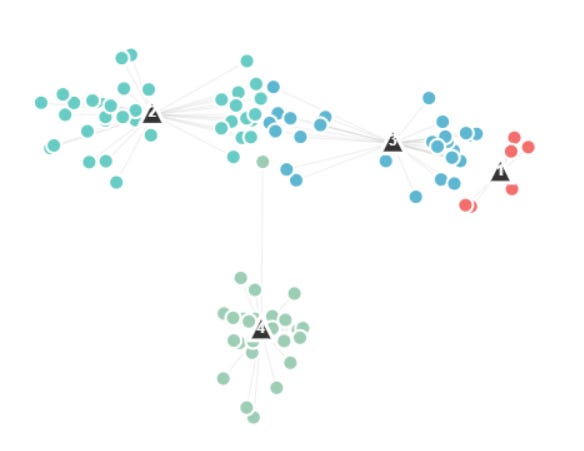
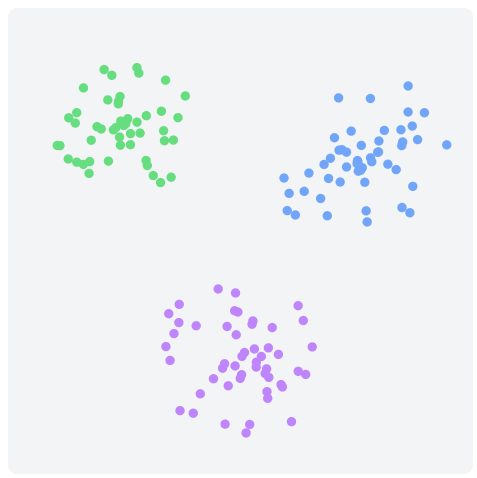
For this example, the method has not yet converged, so we need to do further iterations. At the end of this process we get:
When to Use it?
K-means clustering is particularly well-suited for the following scenarios:
Customer Segmentation: When you need to group customers based on purchasing behavior, demographics, or engagement patterns to create targeted marketing strategies.
Image Compression: K-means can reduce the number of colors in an image by clustering similar colors together, achieving significant compression while maintaining visual quality.
Anomaly Detection: By identifying data points that are far from all cluster centroids, K-means can help detect outliers or unusual patterns in your data.
Document Clustering: When organizing large collections of text documents into topics or themes based on their content similarity.
Preprocessing for Other Algorithms: K-means can create meaningful features or reduce data complexity before applying supervised learning methods.
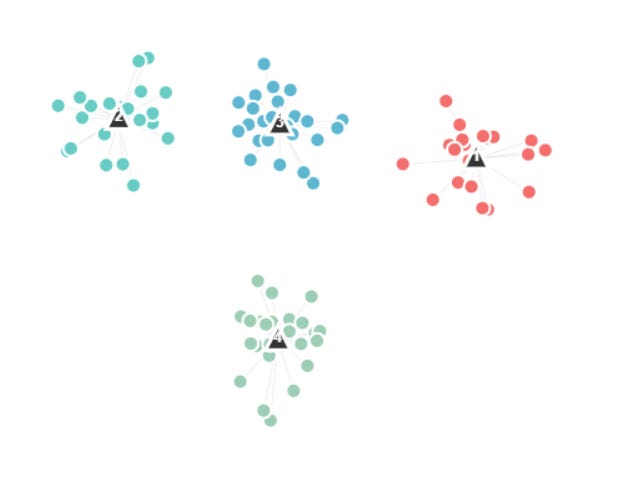
In the previous issue we saw one real use scenario for K-means:

Pros and Cons
Pros:
Simple to understand and implement, making it accessible to practitioners at all levels
Computationally efficient with O(tkn) complexity, where t is iterations, k is clusters, and n is data points
Scales well to large datasets and can be easily parallelized
Works effectively when clusters are spherical and well-separated
Provides crisp cluster assignments that are easy to interpret
Cons:
Requires specifying the number of clusters (K) in advance, which may not always be known
Sensitive to initial centroid placement, potentially converging to local optima
Assumes clusters are spherical and equally sized, struggling with irregular shapes
Sensitive to outliers which can significantly affect centroid positions
May produce different results on different runs due to random initialization
Python Implementation
Here's a basic example of using K-means clustering with the scikit-learn library:
from sklearn.cluster import KMeans
import numpy as np

# Create the K-means model
model = KMeans(n_clusters=3, random_state=42)

# Fit the model to your data
model.fit(X)

# Get cluster assignments for each data point
labels = model.labels_

# Predict cluster for new data points
predictions = model.predict(X_new)
Interpreting the Results
The key outputs from a K-means model that can be interpreted are:
Cluster Centers: The coordinates of each centroid, which represent the "average" characteristics of each cluster and can help you understand what defines each group.
Cluster Labels: The cluster assignment for each data point, indicating which group it belongs to.
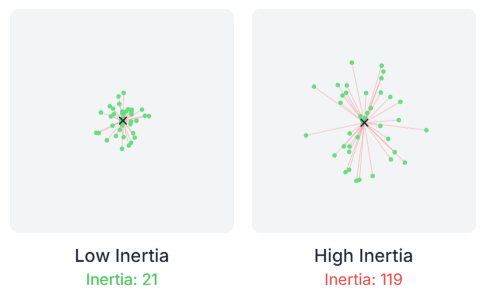
Inertia: The sum of squared distances from each point to its assigned centroid, measuring how compact the clusters are (lower is better).
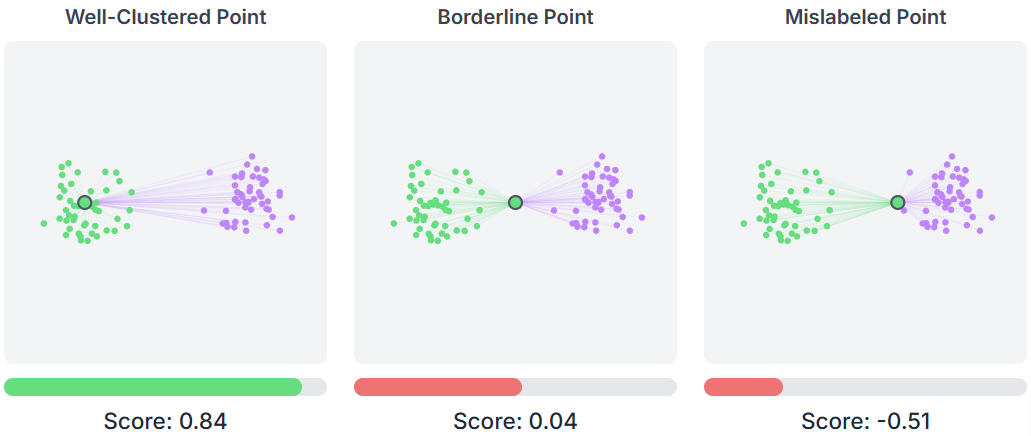
Silhouette Score: A metric ranging from -1 to 1 that measures how similar a point is to its own cluster compared to other clusters.
You can extract and analyze these outputs like this:
# Cluster centers
centers = model.cluster_centers_

# Cluster labels for each point
labels = model.labels_

# Inertia (within-cluster sum of squares)
inertia = model.inertia_

# Number of iterations to converge
n_iter = model.n_iter_

# Silhouette score for evaluation
from sklearn.metrics import silhouette_score
silhouette = silhouette_score(X, labels)
By analyzing these outputs, you can identify the characteristics that define each cluster, assess the quality of your clustering solution, and gain insights into the natural groupings within your data.
Conclusion
K-means clustering remains one of the most widely used unsupervised learning algorithms due to its simplicity, efficiency, and effectiveness in discovering patterns in unlabeled data. While it has limitations with non-spherical clusters and requires careful parameter selection, its speed and interpretability make it an excellent starting point for clustering tasks. Whether you're segmenting customers, compressing images, or exploring data structure, K-means provides a solid foundation for understanding the hidden patterns in your data.
📖 Book of the Week
Mathematics of Machine Learning by Tivadar Danka

Machine learning may feel like magic at times—but behind every model lies a backbone of math. If you want to truly understand how algorithms work (and why they sometimes fail), this book is your entry point.
What makes it stand out?
🧮 Covers the three pillars of ML math: linear algebra, calculus, and probability.
🔗 Bridges theory with practice through Python implementations you can run and adapt.
🎓 Written by Tivadar Danka, a PhD mathematician turned ML engineer with a talent for making complex concepts intuitive.
By the end, you’ll not only be more comfortable reading advanced ML papers, but also more confident tweaking algorithms to fit your own projects.
If you’ve ever thought: “I can train models, but I don’t always understand what’s happening under the hood”—this 700+ page guide is for you.
⚡️Power-Up Corner
Now that you’ve seen how K-means works in practice, let’s push beyond the basics. In this section, we’ll explore some of the trickier but crucial details that can make or break your clustering results:
Choosing the right number of clusters with the elbow and knee methods
Understanding the spherical cluster assumption and why it matters
The importance of initialization (random vs. K-means++)
Going beyond Euclidean distance with Kernel K-means for non-linear clusters
What is the optimal number of clusters?
Keep reading with a 7-day free trial
Subscribe to Machine Learning Pills to keep reading this post and get 7 days of free access to the full post archives.