

Issue #39 - Missing values and scaling in Normal Distribution


💊 Pill of the week
Normal or Gaussian distributions are the most typical distributions found in data. They are also one of the easiest to work with. In this article, we will introduce what a normal distribution is and how to deal with it in the first stages of your analysis. Specifically, we will talk about scaling and missing values identification and handling. You can read the article here:

Last week on DIY #7, we talked about how to identify the distribution of your features during the EDA. That is an excellent starting point before reading this week’s article! You can check it here:

There we shared a notebook with some proposed exercises for you to practise. This week you have the solutions at the end of the newsletter, after the Tech Round-Up!
In the next weeks, we will cover the other steps of the Data Science life cycle:

🤖 Tech Round-Up
This week's TechRoundUp comes full of AI news. From Tesla’s new toy to Meta's AI art leap, the future is zooming towards us! 🚀
Tesla just unveiled Optimus Gen 2, their new humanoid robot! 🤖
Designed to handle repetitive tasks, it's more than just a prototype now
With enhanced features, it's gearing up to revolutionize manufacturing
Singapore's streets are becoming a hub for autonomous buses, thanks to China's WeRide! 🚌
With new licenses, they're testing robobuses, signaling a shift in global AV strategies.
3️⃣ 𝗘𝗨'𝘀 𝗻𝗲𝘄 𝗔𝗜 𝗔𝗰𝘁
The EU's groundbreaking AI Act is here, setting new global standards for AI ethics and transparency! 🌍
It's a significant step in regulating AI's impact on fundamental rights.
4️⃣ 𝗛𝘂𝗺𝗮𝗻 𝗯𝗿𝗮𝗶𝗻 𝗰𝗲𝗹𝗹𝘀 𝗳𝗼𝗿 𝗰𝗼𝗺𝗽𝘂𝘁𝗶𝗻𝗴
Human brain cells on a chip? Yes, it's real! 🧠💻
Researchers have created a hybrid system for speech recognition and simple computations, opening doors to future bio-computers.
Meta's new AI-powered image generator, Imagine, is changing the art scene! 🎨🖼️
Create high-res images with text prompts. Plus, their watermarking tech adds a new layer of AI transparency.
🎓Learn Real-World Machine Learning!*
Do you want to learn Real-World Machine Learning?
Data Science doesn’t finish with the model training… There is much more!

Here you will learn how to deploy and maintain your models, so they can be used in a Real-World environment:
Elevate your ML skills with "Real-World ML Tutorial & Community"! 🚀
Business to ML: Turn real business challenges into ML solutions.
Data Mastery: Craft perfect ML-ready data with Python.
Train Like a Pro: Boost your models for peak performance.
Deploy with Confidence: Master MLOps for real-world impact.
🎁 Special Offer: Use "MASSIVE50" for 50% off.
*Sponsored
📝Check if you were right!
The solutions to the previous DIY issue are here! If you need to refresh your memory, here you have the previous DIY:
We will share the code for how to get each of the graphs and information we shared last week. At the end, you’ll also find a notebook with all the code!
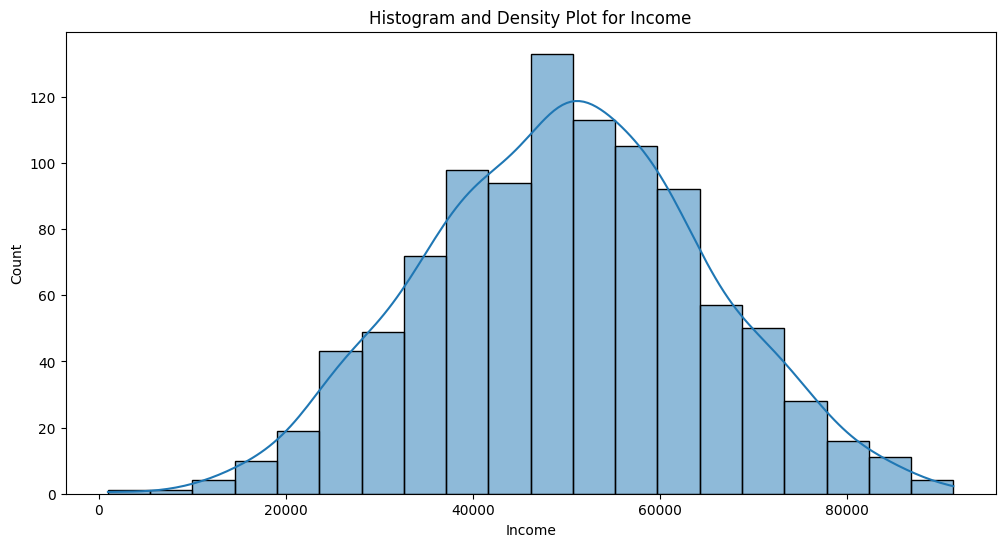
Histograms and Density Plots
plt.figure(figsize=(12, 6))
sns.histplot(df['Income'], bins=20, kde=True)
plt.title(f'Histogram and Density Plot for Income')
plt.show()
For non-numeric features, you’ll need to disable kde (kernel density estimate).
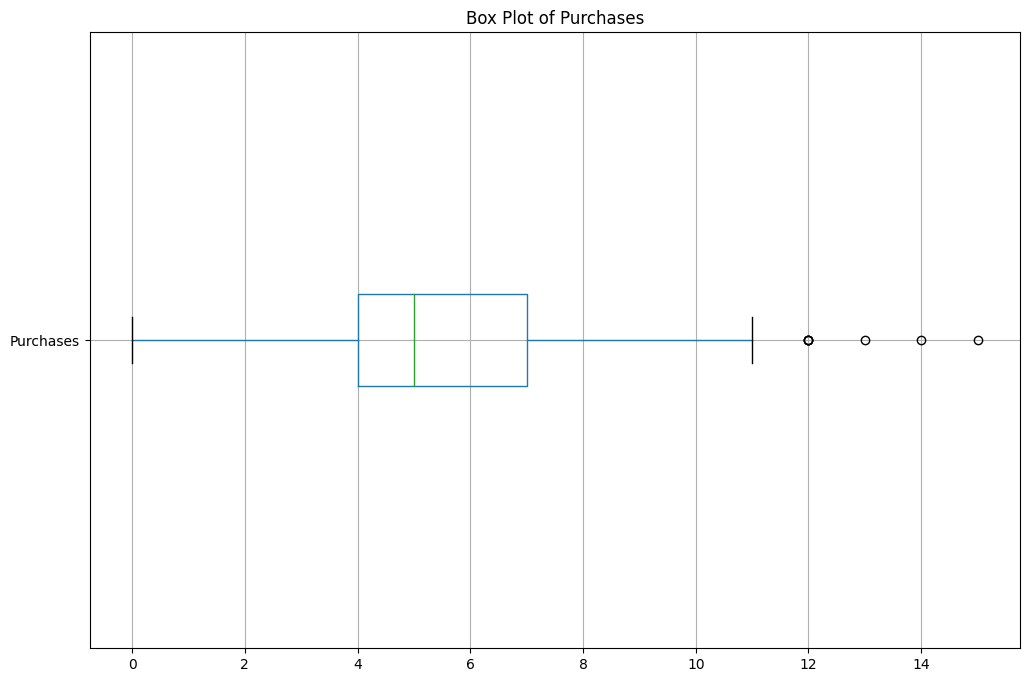
Box Plots
df[['Purchases']].boxplot(figsize=(12, 8), vert=False)
plt.title('Box Plot of Purchases')
plt.show()
Only for numeric features.
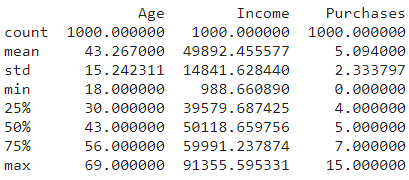
Summary Statistics
summary_stats = df.describe()It will yield results only for numeric features.
Skewness and Kurtosis
Keep reading with a 7-day free trial
Subscribe to Machine Learning Pills to keep reading this post and get 7 days of free access to the full post archives.